
Distributions in Data Science
Discrete Distributions
These are used when the variable can take on only specific, separate values (usually counts).
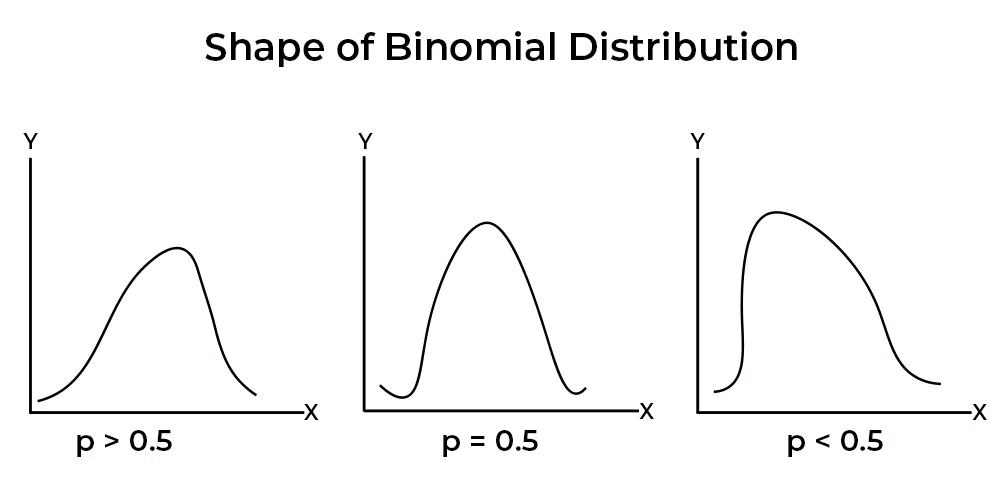
Binomial Distribution
Use: Models the number of successes in a fixed number of independent Bernoulli trials.
Example: Number of defective items in a batch of 100.
Formula for binomial distribution is
where,
Mean:
Variance:
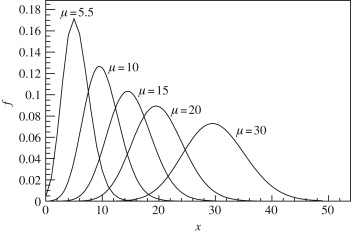
Poisson Distribution
Use: Models the number of events occurring in a fixed interval of time or space.
Example: Number of calls received at a call center in an hour.
Formula:
where,
Mean and Variance can be calculated as:
Geometric Distribution
Use: Models the number of trials until the first success.
Example: Number of coin tosses until the first heads.
Negative Binomial Distribution
Use: Models the number of trials needed to achieve a specified number of successes.
Example: Number of customers visited until 5 sales are made.
Hypergeometric Distribution
Use: Models successes in draws without replacement from a finite population.
Example: Number of red balls drawn from a bag without putting them back.
Continuous Distributions
Used when the variable can take any value in an interval (e.g., time, weight, cost).
Normal Distribution (Gaussian)
Use: Most commonly used; describes natural phenomena like measurement errors.
Example: Heights of people, test scores.
Exponential Distribution
Use: Models time between events in a Poisson process.
Example: Time between arrivals at a service point.
Uniform Distribution
Use: All outcomes in an interval are equally likely.
Example: Time taken for a process that can vary uniformly between 2 and 10 minutes.
Log-Normal Distribution
Use: Models variables whose logarithm is normally distributed.
Example: Stock prices, income distribution.
Gamma Distribution
Use: Models waiting times when multiple events are expected.
Example: Time to complete k tasks.
Beta Distribution
Use: Useful in Bayesian statistics and modeling probabilities themselves.
Example: Estimating the probability of success in project completion.
Weibull Distribution
Use: Common in reliability and survival analysis.
Example: Failure times of machines or components.
Other Relevant Distributions
Multinomial Distribution
Extension of the binomial distribution for multi-category outcomes.
Chi-Square Distribution
Used in hypothesis testing and confidence interval estimation for variance.
t-Distribution
Used in small sample statistical inference for means.
F-Distribution
Used in analysis of variance (ANOVA) and regression.